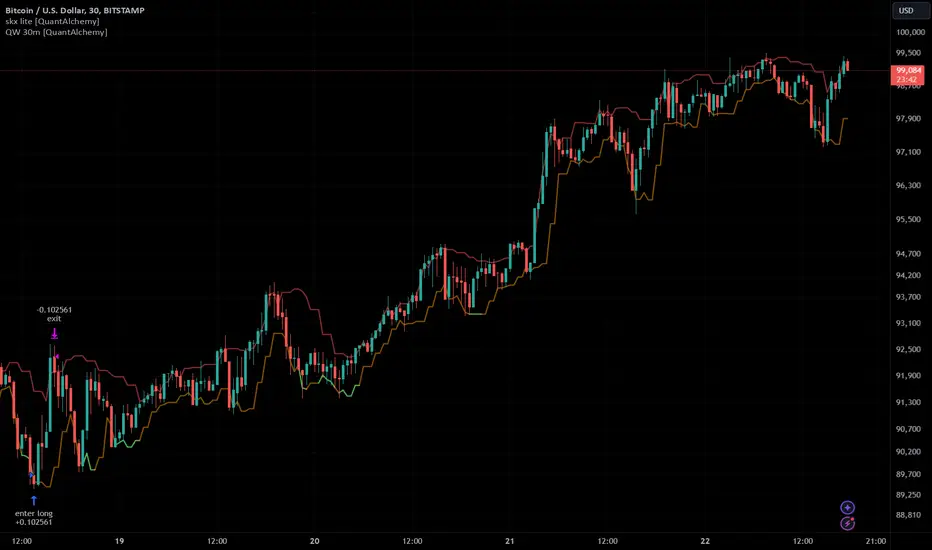
Skeleton Key LiteSkeleton Key Lite Strategy
Note : Every input, except for the API Alerts, depends on an external indicator to provide the necessary values for the strategy to function.
Definitions
Strategy Direction: The trading direction (long or short) as determined by an external source, such as an indicator.
Threshold Conditions:
- Enter Condition: Defines the condition for entering a trade.
- Exit Condition: Defines the condition for exiting a trade.
Stop Loss (SL):
- Trail SL: A trailing stop loss, dynamically updated during the trade.
- Basic SL: A static stop loss level.
- Emergency SL (ER SL): A fallback stop loss for extreme conditions.
- Max SL: The maximum risk tolerance in stop loss.
- Limit SL: A predefined stop loss that is executed as a limit order.
Take Profit (TP):
- Max TP: The maximum profit target for a trade.
- Limit TP: A predefined take profit level executed as a limit order.
API Alerts:
- API Entry: JSON-based configuration for sending entry signals.
- API Exit: JSON-based configuration for sending exit signals.
Broad Concept
The Skeleton Key Lite strategy script is designed to provide a generalized framework for orchestrating trade execution based on external indicators. It allows QuantAlchemy and others to encapsulate strategies into indicators, which can then be backtested and automated using this strategy script.
Inputs
Note : All inputs are dependent on external indicators for values except for the API Alerts.
Strategy Direction:
- Source: Direction signal from an external indicator.
- Options: `LONG` (`1`), `SHORT` (`-1`).
Trade Conditions:
- Enter: Source input, trigger for entry condition.
- Exit: Source input, trigger for exit condition.
Stops and Take Profits:
- Trail SL: Enable/disable dynamic trailing stop loss.
- Basic SL: Enable/disable static stop loss.
- Emergency SL: Enable/disable emergency stop loss.
- Max SL: Enable/disable maximum risk stop loss.
- Max TP: Enable/disable maximum take profit.
- Limit SL: Enable/disable predefined stop loss executed as a limit order.
- Limit TP: Enable/disable predefined take profit executed as a limit order.
Alerts:
- API Entry: Configurable JSON message for entry signals.
- API Exit: Configurable JSON message for exit signals.
How It Works
Trade Logic:
- Conditions for entering and exiting trades are evaluated based on the selected input sources.
Stop Loss and Take Profit Management:
- Multiple stop loss types (trailing, basic, emergency, etc.) and take profit levels are calculated dynamically during the trade entry. Trailing stop loss is updated during the trade based on the selected input.
API Alerts:
- Alerts are triggered using customizable JSON messages, which can be integrated with external trading systems or APIs.
Trade Execution:
- Enter: Initiates a new trade if entry conditions are met and there is no open position.
- Exit: Closes all trades if exit conditions are met or stop loss/take profit thresholds are hit.
Key Features
Customizable: Fully configurable entry and exit conditions based on external indicators.
Encapsulation: Integrates seamlessly with indicators, allowing strategies to be developed as indicator-based signals.
Comprehensive Risk Management:
- Multiple stop loss and take profit options.
- Emergency stop loss for unexpected conditions.
API Integration: Alerts are designed to interface with external systems for automation and monitoring.
Plots
The script plots key variables on the chart for better visualization:
Enter and Exit Signals:
- `enter`: Displays when the entry condition is triggered.
- `exit`: Displays when the exit condition is triggered.
Risk Management Levels:
- `trailSL`: Current trailing stop loss level.
- `basicSL`: Static stop loss level.
- `erSL`: Emergency stop loss level.
- `maxSL`: Maximum risk stop loss level.
Profit Management Levels:
- `maxTP`: Maximum take profit level.
- `limitTP`: Limit-based take profit level.
Limit Orders:
- `limitSL`: Limit-based stop loss level.
- `limitTP`: Limit-based take profit level.
Proposed Interpretations
Entry and Exit Points:
- Use the plotted signals (`enter`, `exit`) to analyze the trade entry and exit points visually.
Risk and Profit Levels:
- Monitor the stop loss (`SL`) and take profit (`TP`) levels to assess trade performance.
Dynamic Trail SL:
- Observe the `trailSL` to evaluate how the trailing stop adapts during the trade.
Limitations
Dependence on Indicators:
- This script relies on external indicators to provide signals for strategy execution.
No Indicator Included:
- Users must integrate an appropriate indicator for source inputs.
Back-Test Constraints:
- Back-testing results depend on the accuracy and design of the integrated indicators.
Final Thoughts
The Skeleton Key Lite strategy by QuantAlchemy provides a robust framework for automated trading by leveraging indicator-based signals. Its flexibility and comprehensive risk management make it a valuable tool for traders seeking to implement and backtest custom strategies.
Disclaimer
This script is for educational purposes only. Trading involves risk, and past performance does not guarantee future results. Use at your own discretion and risk.
Cerca negli script per "the script"
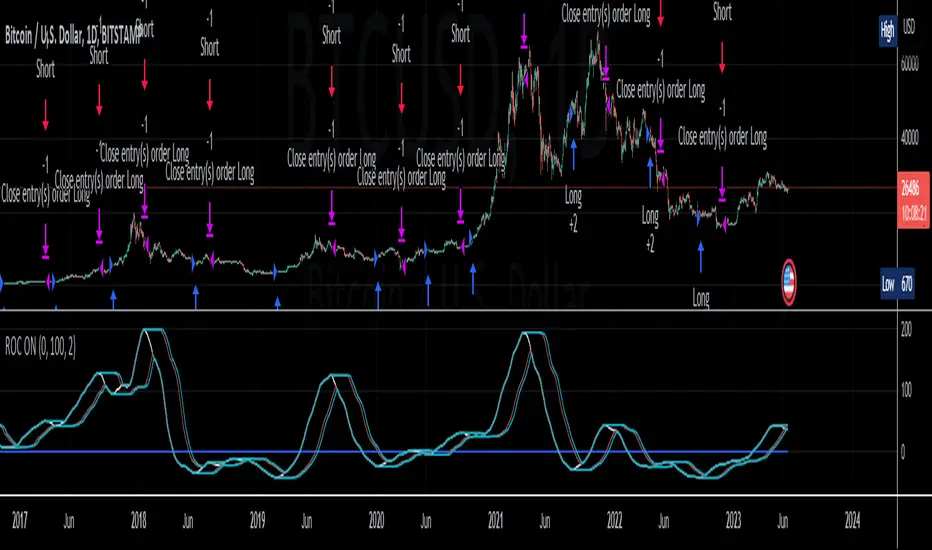
Heikin Ashi ROC Percentile Strategy**User Guide for the "Heikin Ashi ROC Percentile Strategy"**
This strategy, "Heikin Ashi ROC Percentile Strategy", is designed to provide an easy-to-use framework for trading based on the Heikin Ashi Rate of Change (ROC) and its percentiles.
Here's how you can use it:
1. **Setting the Start Date**: You can set the start date for the strategy in the user inputs at the top of the script. The variable `startDate` defines the point from which the script begins executing trades. Simply input the desired date in the format "YYYY MM DD". For example, to start the strategy from March 3, 2023, you would enter `startDate = timestamp("2023 03 03")`.
2. **Adjusting the Midline, Lookback Period, and Stop Loss Level**: The `zerohLine`, `rocLength`, and `stopLossLevel` inputs allow you to adjust the baseline for ROC, the lookback period for the SMA and ROC, and the level at which the strategy stops the loss, respectively. By tweaking these parameters, you can fine-tune the strategy to better suit your trading style or the particular characteristics of the asset you are trading.
3. **Understanding the Trade Conditions**: The script defines conditions for entering and exiting long and short positions based on crossovers and crossunders of the ROC and the upper and lower "kill lines". These lines are defined as certain percentiles of the ROC's highest and lowest values over a specified lookback period. When the ROC crosses above the lower kill line, the script enters a long position; when it crosses below the upper kill line, it exits the position. Similarly, when the ROC crosses below the upper kill line, the script enters a short position; when it crosses above the lower kill line, it exits the position.
In my testing, this strategy performed best on a day and hour basis. However, I encourage you to experiment with different timeframes and settings to see how the strategy performs under various conditions. Remember, there's no one-size-fits-all approach to trading; what works best will depend on your specific circumstances, goals, and risk tolerance.
If you find other useful applications for this strategy, please let me know in the comments. Your feedback is invaluable in helping to refine and improve this tool. Happy trading!
Self Optimizing MACD [Starbots]Self Optimizing MACD Strategy. (non-repainting)
Script constantly tests 15 MACD combinations for maximum profitability and trades based on the best performing combination.
You will notice that signal lines switch sometimes, this is when the strategy optimizes to the better combination and change plots, strategy is dynamic.
There are a lot of black - shadow lines, this are the signals that are not currently active, but script keeps checking and valuating every one of them on every bar close. I recommend using dark mode chart for better view.
MACD /Signal lines in Blue/ Orange are the best performing combination and active at the moment.
*Histogram bars are always displayed based on the default MACD setting (12,26,9) - to keep the script running fast and smoothly. It's not changing plots unlike MACD /Signal lines.
-Turn on MACD Profit Dashboard and spot the worst performing combination to change it and get the better performance overall.
-Backtesting Range - backtest within your desired time window. Example: 'from 01/01/2020 to 01/01/2023'
-Optimizing range - you can decrease the amount of bars/data for optimizing script. This way you can keep it up to date to more recent market by selecting optimizing range to optimize it just from the recent 3-6months of data for example. Strategy before this selected range will normally trade (backtest) based on the first MACD parameters in your menu (12,26,9 by default) if you turn this on.
*I recommend 'Optimizing Range' turned off actually, use max amount of available bars in your history for optimization
- Strategy is trading on the bar close without repaint. You can trade Long-Sell or Long- Short. Alerts available.
- Turn on Profit Calendar for better overview of how your strategy performs monthly/annualy
- Recommended Sources : close, hl2 , hlc3, hlcc4 (when scalping/day trading and market is uptrending good, you can use 'volume' as a source, comes in handy)
- Recommended TF : 30s, 3min, 5min, 10min, 1h, 2h, 4h, 8h, 1d (low timeframes works good if you have no fees like Binance currently do on BTC for example otherwise you probably want to use 1h+ chart)
- MACD parameters : pre-set MACD combinations are very good and common in trading world, you don't need to change them, but you can do it at free will
- Notes window : add your custom comments in or save your webhook message text inside here for later use.
- Trading Session: in a session, you have to specify the time range for every day. It will trade only within this window and close trades when it's out. Session from 9am to 5pm will look like that: 0900-1700 or 7am to 4:30pm 0700-1630. After the colon, you can specify days of the week for your trading session. 1234567 trading all days, 23456 – Monday to Friday ('1 is Sunday here'). 0000-0000:1234567 by default will trade every day nonstop. 00.00am to 00.00pm and 1234567 every day of the week for example - Cryptocurrencies.
This script is simple to use for any trader as it saves a lot of time for searching good parameters on your own. It's also self-optimizing and adjusting to the markets on the go.

Price change scalping short and long strategyPrice change scalping Short and Long strategy uses a rate of change momentum oscillator to calculate the percent change in price between a period of time. Rate of change calculation takes the current price and compares it to a price of "n" periods while the period of time can be defined by a user. The calculated rate of change value is then compared to the upper threshold and the lower threshold values to determine if a position should be opened. If the threshold is crossed and filtering conditions are met a strategy position will be triggered. Entry, take profit, and stop loss prices are calculated and displayed on the chart as well as positions directions. Once the entry price is crossed, a long or short position is created and once the take profit price is crossed, the stop loss price will begin to trail behind the price action using the close of the previous bar. Once the trailing stop price is crossed, the position is closed. If the entry price is not crossed and the price action crosses the stop level, the trade setup is cancelled. The strategy is enhanced by DCA algorithm which allows to average entry price with safety orders. The script also allows to use Martingale coefficient to increase averaging power
Advantages of this script:
Strategy has high net profit of 293% at backtests
Backtests show high accuracy around 71%
High frequency and low duration of trades
Can be used with short-term timeframes ranging from 5 to 60 minutes
Strategy is sustainable to market slumps due to DCA implementation
Can be used for short and long positions (can be adjusted to long only, short only or both)
Can be applied to any market and quote currency
Easy to configure user interface settings
Built in detailed statistic menu
How to use?
1. Apply the strategy to a trading pair your are interested in using 5 to 60 minutes timeframe chart
2. Configure the strategy: change layer values, order size multiple and take profit/stop loss values according to current market cycle stage
3. Set up a TradingView alert to trigger when strategy conditions are met
4. Strategy will send alerts when to enter and when to exit positions which can be applied to your portfolio using external trading platforms
5. Update settings once market conditions are changed using backtests on a monthly period

VIDYA Trend StrategyOne of the most common messages I get is people reaching out asking for quantitative strategies that trade cryptocurrency. This has compelled me to write this script and article, to help provide a quantitative/technical perspective on why I believe most strategies people write for crypto fail catastrophically, and how one might build measures within their strategies that help reduce the risk of that happening. For those that don't trade crypto, know that these approaches are applicable to any market.
I will start off by qualifying up that I mainly trade stocks and ETFs, and I believe that if you trade crypto, you should only be playing with money you are okay with losing. Most published crypto strategies I have seen "work" when the market is going up, and fail catastrophically when it is not. There are far more people trying to sell you a strategy than there are people providing 5-10+ year backtest results on their strategies, with slippage and commissions included, showing how they generated alpha and beat buy/hold. I understand that this community has some really talented people that can create some really awesome things, but I am saying that the vast majority of what you find on the internet will not be strategies that create alpha over the long term.
So, why do so many of these strategies fail?
There is an assumption many people make that cryptocurrency will act just like stocks and ETFs, and it does not. ETF returns have more of a Gaussian probability distribution. Because of this, ETFs have a short term mean reverting behavior that can be capitalized on consistently. Many technical indicators are built to take advantage of this on the equities market. Many people apply them to crypto. Many of those people are drawn down 60-70% right now while there are mean reversion strategies up YTD on equities, even though the equities market is down. Crypto has many more "tail events" that occur 3-4+ standard deviations from the mean.
There is a correlation in many equities and ETF markets for how long an asset continues to do well when it is currently doing well. This is known as momentum, and that correlation and time-horizon is different for different assets. Many technical indicators are built based on this behavior, and then people apply them to cryptocurrency with little risk management assuming they behave the same and and on the same time horizon, without pulling in the statistics to verify if that is actually the case. They do not.
People do not take into account the brokerage commissions and slippage. Brokerage commissions are particularly high with cryptocurrency. The irony here isn't lost to me. When you factor in trading costs, it blows up most short-term trading strategies that might otherwise look profitable.
There is an assumption that it will "always come back" and that you "HODL" through the crash and "buy more." This is why Three Arrows Capital, a $10 billion dollar crypto hedge fund is now in bankruptcy, and no one can find the owners. This is also why many that trade crypto are drawn down 60-70% right now. There are bad risk practices in place, like thinking the martingale gambling strategy is the same as dollar cost averaging while also using those terms interchangeably. They are not the same. The 1st will blow up your trade account, and the 2nd will reduce timing risk. Many people are systematically blowing up their trade accounts/strategies by using martingale and calling it dollar cost averaging. The more risk you are exposing yourself too, the more important your risk management strategy is.
There is an odd assumption some have that you can buy anything and win with technical/quantitative analysis. Technical analysis does not tell you what you should buy, it just tells you when. If you are running a strategy that is going long on an asset that lost 80% of its value in the last year, then your strategy is probably down. That same strategy might be up on a different asset. One might consider a different methodology on choosing assets to trade.
Lastly, most strategies are over-fit, or curve-fit. The more complicated and more parameters/settings you have in your model, the more likely it is just fit to historical data and will not perform similar in live trading. This is one of the reasons why I like simple models with few parameters. They are less likely to be over-fit to historical data. If the strategy only works with 1 set of parameters, and there isn't a range of parameters around it that create alpha, then your strategy is over-fit and is probably not suitable for live trading.
So, what can I do about all of this!?
I created the VIDYA Trend Strategy to provide an example of how one might create a basic model with a basic risk management strategy that might generate long term alpha on a volatile asset, like cryptocurrency. This is one (of many) risk management strategies that can reduce the volatility of your returns when trading any asset. I chose the Variable Index Dynamic Average (VIDYA) for this example because it's calculation filters out some market noise by taking into account the volatility of the underlying asset. I chose a trend following strategy because regressions are capturing behaviors that are not just specific to the equities market.
The more volatile an asset, the more you have to back-off the short term price movement to effectively trend-follow it. Otherwise, you are constantly buying into short term trends that don't represent the trend of the asset, then they reverse and loose money. This is why I am applying a trend following strategy to a 4 hour chart and not a 4 minute chart. It is also important to note that following these long term trends on a volatile asset exposes you to additional risk. So, how might one mitigate some of that risk?
One of the ways of reducing timing risk is scaling into a trade. This is different from "doubling down" or "trippling down." It is really a basic application of dollar cost averaging to reduce timing risk, although DCA would typically happen over a longer time period. If it is really a trend you are following, it will probably still be a trend tomorrow. Trend following strategies have lower win rates because the beginning of a trend often reverses. The more volatile the asset, the more likely that is to happen. However, we can reduce risk of buying into a reversal by slowly scaling into the trend with a small % of equity per trade.
Our example "VIDYA Trend Strategy" executes this by looking at a medium-term, volatility adjusted trend on a 4 hour chart. The script scales into it with 4% of the account equity every 4-hours that the trend is still up. This means you become fully invested after 25 trades/bars. It also means that early in the trade, when you might be more likely to experience a reversal, most of your account equity is not invested and those losses are much smaller. The script sells 100% of the position when it detects a trend reversal. The slower you scale into a trade, the less volatile your equity curve will be. This model also includes slippage and commissions that you can adjust under the "settings" menu.
This fundamental concept of reducing timing risk by scaling into a trade can be applied to any market.
Disclaimer: This is not financial advice. Open-source scripts I publish in the community are largely meant to spark ideas that can be used as building blocks for part of a more robust trade management strategy. If you would like to implement a version of any script, I would recommend making significant additions/modifications to the strategy & risk management functions. If you don’t know how to program in Pine, then hire a Pine-coder. We can help!

Smoothed Heikin Ashi Trend on Chart - TraderHalai BACKTESTSmoothed Heikin Ashi Trend on chart - Backtest
This is a backtest of the Smoothed Heikin Ashi Trend indicator, which computes the reverse candle close price required to flip a Heikin Ashi trend from red to green and vice versa. The original indicator can be found in the scripts section of my profile.
This particular back test uses this indicator with a Trend following paradigm with a percentage-based stop loss.
Note, that backtesting performance is not always indicative of future performance, but it does provide some basis for further development and walk-forward / live testing.
Testing was performed on Bitcoin , as this is a primary target market for me to use this kind of strategy.
Sample Backtesting results as of 10th June 2022:
Backtesting parameters:
Position size: 10% of equity
Long stop: 1% below entry
Short stop: 1% above entry
Repainting: Off
Smoothing: SMA
Period: 10
8 Hour:
Number of Trades: 1046
Gross Return: 249.27 %
CAGR Return: 14.04 %
Max Drawdown: 7.9 %
Win percentage: 28.01 %
Profit Factor (Expectancy): 2.019
Average Loss: 0.33 %
Average Win: 1.69 %
Average Time for Loss: 1 day
Average Time for Win: 5.33 days
1 Day:
Number of Trades: 429
Gross Return: 458.4 %
CAGR Return: 15.76 %
Max Drawdown: 6.37 %
Profit Factor (Expectancy): 2.804
Average Loss: 0.8 %
Average Win: 7.2 %
Average Time for Loss: 3 days
Average Time for Win: 16 days
5 Day:
Number of Trades: 69
Gross Return: 1614.9 %
CAGR Return: 26.7 %
Max Drawdown: 5.7 %
Profit Factor (Expectancy): 10.451
Average Loss: 3.64 %
Average Win: 81.17 %
Average Time for Loss: 15 days
Average Time for Win: 85 days
Analysis:
The strategy is typical amongst trend following strategies with a less regular win rate, but where profits are more significant than losses. Most of the losses are in sideways, low volatility markets. This strategy performs better on higher timeframes, where it shows a positive expectancy of the strategy.
The average win was positively impacted by Bitcoin’s earlier smaller market cap, as the percentage wins earlier were higher.
Overall the strategy shows potential for further development and may be suitable for walk-forward testing and out of sample analysis to be considered for a demo trading account.
Note in an actual trading setup, you may wish to use this with volatility filters, combined with support resistance zones for a better setup.
As always, this post/indicator/strategy is not financial advice, and please do your due diligence before trading this live.
Original indicator links:
On chart version -
Oscillator version -
Update - 27/06/2022
Unfortunately, It appears that the original script had been taken down due to auto-moderation because of concerns with no slippage / commission. I have since adjusted the backtest, and re-uploaded to include the following to address these concerns, and show that I am genuinely trying to give back to the community and not mislead anyone:
1) Include commission of 0.1% - to match Binance's maker fees prior to moving to a fee-less model.
2) Include slippage of 10 ticks (This is a realistic slippage figure from searching online for most crypto exchanges)
3) Adjust account balance to 10,000 - since most of us are not millionaires.
The rest of the backtesting parameters are comparable to previous results:
Backtesting parameters:
Initial capital: 10000 dollars
Position size: 10% of equity
Long stop: 2% below entry
Short stop: 2% above entry
Repainting: Off
Smoothing: SMA
Period: 10
Slippage: 10 ticks
Commission: 0.1%
This script still remains to shows viability / profitablity on higher term timeframes (with slightly higher drawdown), and I have included the backtest report below to document my findings:
8 Hour:
Number of Trades: 1082
Gross Return: 233.02%
CAGR Return: 14.04 %
Max Drawdown: 7.9 %
Win percentage: 25.6%
Profit Factor (Expectancy): 1.627
Average Loss: 0.46 %
Average Win: 2.18 %
Average Time for Loss: 1.33 day
Average Time for Win: 7.33 days
Once again, please do your own research and due dillegence before trading this live. This post is for education and information purposes only, and should not be taken as financial advice.

Stochastic Moving AverageHi all,
This Strategy script combines the power of EMAs along with the Stochastic Oscillator in a trend following / continuation manner, along with some cool functionalities.
I designed this script especially for trading altcoins, but it works just as good on Bitcoin itself and on some Forex pairs.
______ SIGNALS ______
The script has 4 mandatory conditions to unlock a trading signal. Find these conditions for a long trade below (works the exact other way round for shorts)
- Fast EMA must be higher than Slow EMA
- Stochastic K% line must be in oversold territory
- Stochastic K% line must cross over Stochastic D% line
- Price as to close between slow EMA and fast EMA
Once all the conditions are true, a trade will start at the opening of the next
______ SETTINGS ______
- Trade Setup:
Here you can choose to trade only longs or shorts and change your Risk:Reward.
You can also decide to adjust your volume per position according to your risk tolerance. With “% of Equity” your stop loss will always be equal to a fixed percentage of your initial capital (will “compound” overtime) and with “$ Amount” your stop loss will always be 'x' amount of the base currency (ex: USD, will not compound)
Stop Loss:
The ATR is used to create a stop loss that matches current volatility. The multiplier corresponds to how many times the ATR stop losses and take profits will be away from closing price.
- Stochastic:
Here you can find the usual K% & D% length and overbought (OB) and oversold (OS) levels.
The “Stochastic OB/OS lookback” increase the tolerance towards OB/OS territories. It allows to look 'x' bars back for a value of the Stochastic K line to be overbought or oversold when detecting an entry signal.
The “All must be OB/OS” refers to the previous “Stochastic OB/OS lookback” parameter. If this option is ticked, instead of needing only 1 OB/OS value within the lookback period to get a valid signal, now, all bars looked back must be OB/OS.
The color gradient drawn between the fast and slow EMAs is a representation of the Stochastic K% line position. With default setting colors, when fast EMA > slow EMA, gradient will become solid blue when Stochastic is oversold and when slow EMA > fast EMA, gradient will become solid blue when Stochastic is overbought
- EMAs:
Just pick your favorite ones
- Reference Market:
An additional filter to be certain to stay aligned with the current a market index trend (in our case: Bitcoin). If selected reference market (and timeframe) is trading above selected EMA, this strategy will only take long trades (vice-versa for shorts) Because, let’s face it… even if this filter isn’t bulletproof, you know for sure that when Bitcoin tanks, there won’t be many Alts going north simultaneously. Once again, this is a trend following strategy.
A few tips for increased performance: fast EMA and D% Line can be real fast… 😉
As always, my scripts evolve greatly with your ideas and suggestions, keep them coming! I will gladly incorporate more functionalities as I go.
All my script are tradable when published but remain work in progress, looking for further improvements.
Hope you like it!

Swing Trades Validator - The One TraderThis swing trading strategy validator is built on the original strategy taught in my bootcamp for swing traders.
The strategy is simple and follows a trend trading pattern on prices reacting to Exponential Moving Averages over a multiple time-frame analysis.
The details of the strategy are as follows:
- Holding Period : Upto a couple of months
- Time-frames to be analysed : Month - Week - Day
- Trade Execution : Daily Time-frame
Analysis Details:
Step 1 : On the Monthly time-frame, the candle needs to be bullish with the latest close being higher than the opening price of the month.
Step 2 : The price needs to be above the 8ema on the Monthly time-frame.
Step 3 : The 8ema must be above the 20ema on the Monthly time-frame.
The above steps indicate a bullish strength in the instrument on the Monthly time-frame.
Step 4 : On the Weekly time-frame, the candle needs to be bullish with the latest close being higher than the opening price of the week.
Step 5 : The price needs to be above the 8ema on the Weekly time-frame.
Step 6 : The 8ema must be above the 20ema on the Weekly time-frame.
The above steps indicate a bullish strength in the instrument on the Weekly time-frame.
Step 7 : On the Daily time-frame, the candle needs to be bullish with the latest close being higher than the opening price of the day.
Step 8 : The price needs to be above the 8ema on the Daily time-frame.
Step 9 : The 8ema must be above the 20ema on the Daily time-frame.
The above steps indicate a bullish strength in the instrument on the Daily time-frame.
Step 10 : While the 8ema is above the 20ema on the Daily time-frame, the price must be allowed to rise before a pullback is seen towards the moving averages, indicating a bearish move trying to change the trend.
Step 11 : These pullback candles need to form a pattern called the Ring Low with the second pullback candle having a lower high and lower low and the low of the last pullback candle being lesser than or equal to the fat ema on the Daily time-frame.
Step 12 : If the stock is still bullish and the trend is displaying a strength in the underlying bullish direction, then there will be a resumption candle that will have a closing price higher than the previous day's high price.
This trend continuation signal is a confirmation that the instrument will continue in the underlying trend direction and we will be able to enter if this condition is satisfied.
The profit and loss percentages are set at a default 10% as this can be a minimum risk : reward for swing trades on average, but the inputs have been made available to the users in order to adjust the risk : reward to find the most optimum breathing room for each individual stock or instrument. This will give the user a highly custom overview of the strategy on individual instruments based on their volatility and price movements.
The strategy tester will auto back-test this strategy historically and find all the trades that were taken based on this strategy and populate a performance summary.
The most important data in V1.0 of this script are as follows:
1. No. of Trades Taken : We want to see many trades being taken on this strategy in that particular instrument. This shows us a healthy report on the number of winning vs. losing trades.
2. Percentage Profitable : We want to see that this strategy has worked out in the past and is giving us a high probability of return. This in no way an indication that the strategy will definitely work out in the future as well, but gives us an idea of whether or not we should enter this trade.
3. No. of Winning Trades vs. Losing Trades : We would like to see a significantly higher number of winning trades.
4. Avg. # of bars in a trade : This gives us an idea of how long on average we might have to wait to see the results of this strategy either in favor of our reward or against our desired direction. Some trades can be completed in around 15-20 bars on average and some trades have shown to take upto 45 days to reach desired reward. This is in line with our planned holding period, but gives the trader a sense of time and increased level of patience.
The future updates will have more utility of the various elements of the strategy tester and the entire exit strategy will be integrated into the script.
This script is not to be used as a standalone method and must be studied well in order to execute trades. I have not hidden visibility on other time-frames, but since order execution is done on the Daily time-frame, the script must run on the Daily time-frame only.
There are many other factors to be taken into consideration before entering a trade and proper risk management and position sizing rules must be followed.
Our bootcamp participants will use this strategy tester in conjunction with the invite-only Trading Toolkit assigned to them.
The development of this script will be ongoing and all comments and feedback are welcome.

Godtrix's Crypto HA+RSI+EMA+ATH+DCA Strategy 3.0New Updates is here! Upgrade from previous version 2.0 (Please avoid using v2.0 as it's outdated.)
Great stability, Repaint bug fixes, and New features!
==================
| Introduction: |
==================
This is a Long Term Strategy, using compounding profit method, it can generate high returns, but it also risk for losses, this can be overcome if you set Stop Loss to over 25% for bitcoin & 60% for Altcoins.
Best profit plan with this strategy is you trade on Future leverage while you hold on to your coin, so that when price goes up, your coin value goes up, and at the same time, you trade with your leverage to earn even more, easily doubling up your total profit.
Benefits:
Fully customizable and you can easily personalized it and FINE TUNE it according to the market or coin you trading on.
The strategy is based on REAL PRACTICAL trading skills, so it works in real-world.
I fixed the "repainting" issue so the backtest it shows you IS ACCURATE when you run for real-time.
We all know one indicator is not going to help you win your trades, so this strategy combines ALL three: EMA for long+short term trend, HA for short term trend, RSI for entry/exit
This strategy is designed for LONG trade (Buy low, Sell high), not for SHORT trade.
This is not day trading, it is more to mid-term trading, where there's only few trades per month
Mainly is coded to work with 3Commas bot auto trading, so you only need to key in your Bot ID & Email Token.
Bot trading NOTE:
- You need to replace the Alert Message with this: {{strategy.order.alert_message}}
- And you'll need the Bot's webhook Url set with the Alert too.
- One Alert will work for both Buy and Sell Order
- If you using other Bot service, you can enter Custom Command in Input Settings too, it works on any bot service.
Lastly,
regarding the setting advice, I would say you try playing with different settings and your objective is to achieve a backtest result that has:
1) Profitable is > 80%
2) Losing trades is nearly 0 or below 25% of your winning trades. Trick is using far stop loss %
3) Net Profit be almost same or more than "Buy & Hold Profit"
==================
| Latest Updates: |
==================
=| Tidy Up Codings |=
- Group input fields so it'll be easier to understand and find the settings
- Upgrade code for obsolete 'transp' options
=| Repaint Issues |=
- Previous v2.0's RSI has repaint issue, creating false result against real-time data. I've fixed this.
- Also done fine-tuning other parts of the codes to prevent possible repaint issues.
=| Bot System |=
- Improved Custom Bot system, so that you're able to set dynamic order size/quantity with my custom keyword: and
Base Order Example:
{ 'message_type': 'bot', 'bot_id': 1234567, 'email_token': 'abcdefgh-1234-1234-1234', 'base_order': , 'delay_seconds': 0, 'pair': 'USDT_BTC'}
=| EMA Downtrend Exit |=
- Added option for you to decide whether to close position when detected EMA Long term downtrend.
=| EMA 2 (short term) is removed |=
- After several test, I've decided to remove this because it doesn't contribute to improving the results.
=| Heikin Ashi System |=
- Improved the chart display, now you'll see the HA candle 'shadowed' behind, so you'll see both actual price candle and HA candle at same time.
- Added the system that detect the HA candle sizes to decide specifically when it's suitable for Entry and Exit.
>> For "Entry/Exit Range"
- This means after HA is valid for Entry or Exit, how many following bars are allowed to stay valid so it will match other requirements to be completely fulfilled for Entry or Exit.
>> For "Crossing Interval"
- This means after detected HA line crossover, how many HA intervals is allow to Entry or Exit
>> For "Reversed Exit"
- This function let's you decide whether to close position if after HA bull (green candle) changed into HA Bear (red candle)
=| RSI A Entry |=
- Added option to avoid Entry during NTZ (No trade Zone)
- Also added the option to avoid next same condition RSI A entry too soon
=| RSI B Entry |=
- This function is for Entry if RSI is going very low, mostly due to bigger price drops in short time, it's good for buying DIP, however we'll never be able to know when a DIP ends, so do more test on this settings before put into real use.
- Added "avoid" options to help avoid getting Entry at "false" DIP, more like a short & fast pullback which causes RSI to drop very low but actually the price is near ATH or Recent High.
- Added option for Entry with Trailing Price Lower Buy combine with a limit order that grabs low price, so whichever it fulfill first.
=| New: Avoid Entry |=
- Well, it's a pain if you bought at the top, so I've added two options that will avoid buying near ATH and Recent High.
=| Time-limit Removed |=
- Sorry that I've missed look on the script policy which I'm not allowed to put a time-limit for public scripts.
=| System Improvements |=
- HA condition detection is optimized and bug fixed
- RSI values now reads accurately on each bar despite using higher timeframe, especially when moving to next interval
=| New: Dollar Cost Averaging (DCA) Orders |=
- Although DCA strategy is not appealing for Long term strategy, but I've added it for your extra options and flexibilities.
- The settings are quite straight-forward and standard, so I won't be explaining here.
=| New: Backtest Start & End Date |=
- This is very good function when you need more accurate result starting at specific date & time.
- Also if you set the date & time for your real trading starts, it'll much result the same as your actual trading records, which helps you to see clearer and make future decisions.
Any found bugs or flaws, please feel free to PM me, I can't get notifications from comments here below, so I'll not able to reply you the soonest possible, still not sure how to turn on notification for comments, anyone who knows can PM and teach me, lol... Thanks in advance!
Well, this is free version, hope it helps! Feedbacks are all welcome :)
(To Moderators: I've fully use the "f_security()" guideline, but instead of creating a separate function, I apply directly on all security() function. Please don't ban my script before fully check if I've truly fixed repaint. Thank you.)
BITSTAMP:BTCUSD COINBASE:BTCUSD COINBASE:ETHUSD BINANCE:BNBUSDT

Pyramiding BTC 5 minThe pyramide based on this script with his concent
the strategy is the same as BTC 15 script (look at my open scripts) there it without pyramide
you can use the filter if you wish
one trick if you want it to be more accurate (not mean more profit is to reverse the long and short in the filter ' just it will lose less)
about the strategy of pyrimde you can read in detail from the script of Coinrule
i modify only to have 5 step in the pyramide scheme on 20% of equity (seems more logical)
so let me me know what you think:)

T3-CCI Strategy [SystemAlpha]This is a strategy based on FX Sniper's T3-CCI indicator. Instead of using just the normal buy and sell signal, we added an option to use trend filters, trailing stop loss and take profit targets.
In this strategy you have a choice of:
Trend Filters:
- Average Directional Index ( ADX ) – buy when price is trend is up and sell when trend is down.
- Moving Average (MA) – buy when price close above the defined moving average and sell when price close below moving average
- Parabolic SAR – buy when SAR is above price is above price and sell when SAR is below price.
- All - Use ADX , MA and SAR as filters
For MA Filter , you can use the “TF MA Type” and "TF MA Period" parameter to select Simple or Exponential Moving Average and length.
Stop Loss:
- Average True Range (ATR) – ATR % stop as trailing stop loss.
- Parabolic SAR ( SAR ) – Parabolic SAR adapted as trailing stop loss.
For ATR , you can use the “ATR Trailing Stop Multiplier” parameter to set an initial offset for trailing stop loss.
Take Profit Target:
- Average True Range (ATR) – ATR % stop as trailing stop loss.
- Standard % – Percent as target profit
For ATR , you can use the “ATR Take Profit Multiplier” parameter to set an initial offset for trailing stop loss.
Additional feature include:
- Show Bar Colors
STRATEGY ONLY:
- Set back test date range
- Set trade direction - Long, Short or Both
- Use timed exit - Select method and bars
- Method 1: Exit after specified number of bars.
- Method 2: Exit after specified number of bars, ONLY if position is currently profitable.
- Method 3: Exit after specified number of bars, ONLY if position is currently losing.
TradingView Links:
Alerts:
T3-CCI Indicator:
Advance ADX:
How to use:
1. Apply the script by browsing through Indicators --> Invite-Only scripts and select the indicator
2. Once loaded, click the gear (settings) button to select/adjust the parameters based on your preference.
3. Wait for the next BUY or SELL signal to enter the trade!
Disclaimer:
The indicator and signals generated do not constitute investment advice; are provided solely for informational purposes and therefore is not an offer to buy or sell a security; are not warranted to be correct, complete or accurate; and are subject to change without notice.

S&P Bear Warning IndicatorTHIS SCRIPT HAS BEEN BUILT TO BE USED AS A S&P500 SPY CRASH INDICATOR ON A DAILY TIME FRAME (should not be used as a strategy).
THIS SCRIPT HAS BEEN BUILT AS A STRATEGY FOR VISUALIZATION PURPOSES ONLY AND HAS NOT BEEN OPTIMIZED FOR PROFIT.
The script has been built to show as a lower indicator and also gives visual SELL signal on top when conditions are met. BARE IN MIND NO STOP LOSS, NOR ADVANCED EXIT STRATEGY HAS BEEN BUILT.
As well as the chart SELL signal an alert option has also been built into this script.
The script utilizes a VIX indicator (maroon line) and 50 period Momentum (blue line) and Danger/No trade zone(pink shading).
When the Momentum line crosses down across the VIX this is a sell off but in order to only signal major sell offs the SELL signal only triggers if the momentum continues down through the danger zone.
A SELL signal could be given earlier by removing the need to wait for momentum to continue down through the Danger Zone however this is designed only to catch major market weakness not small sell offs.
As you can see from the picture between the big October 2018 and March 2020 market declines only 2 additional SELLS were triggered.
To use this indicator to identify ideal buying then you should only buy when Momentum line is crossed above the VIX and the Momentum line is above the Danger Zone (ideally 3 - 5 days above danger zone)

JackTrendChaser V3Hi everyone! I am so thrilled to announce this!
>> LIMITED TIME OFFER, read below! <<
My name is Jack and I have been trading trends using TA on Forex for 10 years now and have within the past two years been trading Bitcoin and other cryptocurrencies.
I am a part time trader and developer. On a daily basis I work as a software developer creating various algorythms for big data usage - such as machine learning etc. and I have found a passion in creating scripts to predict major trend moves. Which is why I would like to share this script (strategy) with you all!
Looking at the stats it looks amazing! 100% profitability - who doesn't want that?! But that doesn't mean it cannot be improved - I am daily looking into how I can improve this to become even more profitable.
Currently the script have been tested with BTC and ETH:
BTC = 100% profitability and 9 trades since 2016
ETH = 83% profitability and 6 trades since 2016 with a drawdown of $5.
Now - 9 and 6 trades since 2016 isn't many trades but it suites my way of trading perfectly! I aim for the major trends and try to hit the pullbacks as soon as possible.
You can use this script alone or with other complimenting indicators. I like to draw some support and resistance levels for even further verification.
TRIAL OFFER:
Everyone is offered a 15 days trail.
Let me know in the comments if you would like a trail. Please do not PM me for trails.
>> LIMITED TIME OFFER <<
Since this is my first script to publish on TradingView I am offering the FIRST 10 traders a LIFETIME access to the script for a very small price! After that everyone else will be able to buy acces for 1m, 6m, 1y or lifetime (but at a higher price).
So how do you become one of the first 10?! Simpel - just PM me for the details.
I will update this post when the first 10 has been chosen.
>> OBS: I might be away from TradingView up to 24hours at a time because of my job - but don't panic! I will keep track of every message and get back to everyone as soon as possible!
Best regards
Jack

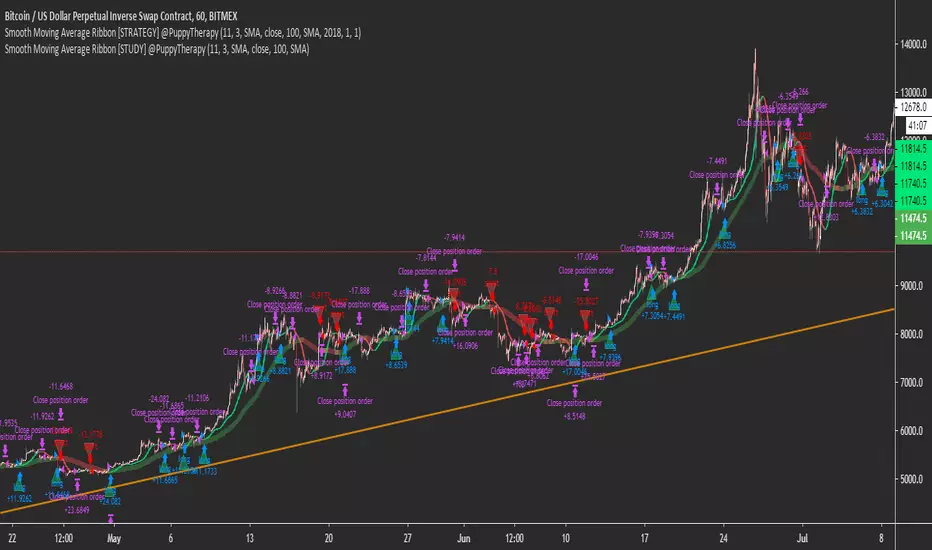
Smooth Moving Average Ribbon [STRATEGY] @PuppyTherapyThe Smooth moving average ribbon script is an enhancement of the script I posted yesterday. But will help you also create a very simple trend-following strategy or a simple trend-following filter.
You are able to select from a large variety of moving averages add Heikin Ashi Candles as a source and also add additional smoothing to every single of the moving averages.
The Strategy is using the basic backtesting engine.
It is a showcase that a simple strategy like buy when we going up and sell when we going down actually works especially on a bigger timeframe.
Thanks to all supporters and everget for some of the moving average scripts.
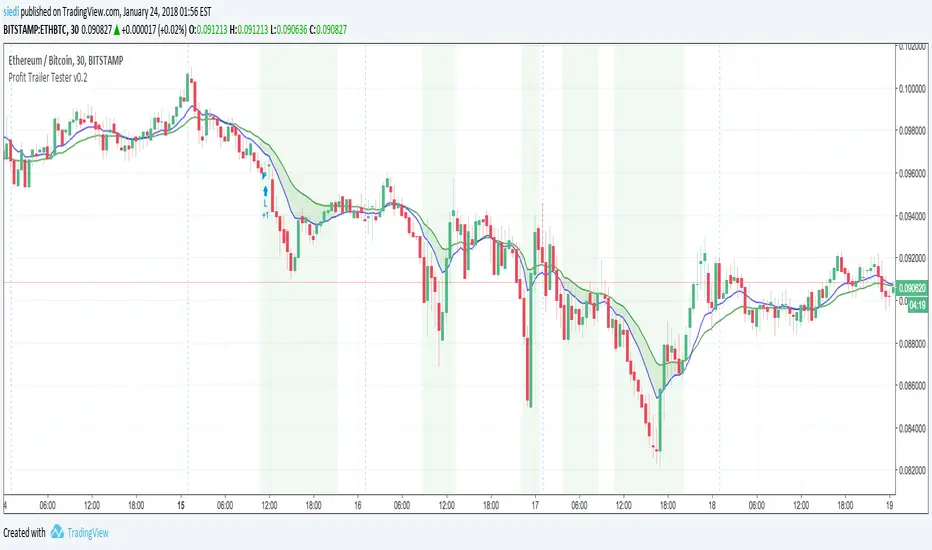
Profit Trailer Tester v0.2This script combines all buy and sell strategies of the Profit Trailer bot for research, backtesting (simulation) and teaching those strategies. Due to several reasons, the script cannot emulate the Profit Trailer strategies 100%. It is more to visualize the strategies and support you in your decisions.
It is an early version and still under heavy development and testing. Currently, 'DCA' and trailing are not implemented yet.
Please send a PM to get access to the script.
NOTICE: By requesting access to this script you acknowledge that you have read and understood that this is for research purposes only, and I am not responsible for any financial losses you may incur by using this script!
Reversal Trading Bot Strategy[BullByte]Overview :
The indicator Reversal Trading Bot Strategy is crafted to capture potential market reversal points by combining momentum, volatility, and trend alignment filters. It uses a blend of technical indicators to identify both bullish and bearish reversal setups, ensuring that multiple market conditions are met before entering a trade.
Core Components :
Technical Indicators Used :
RSI (Relative Strength Index) :
Purpose : Detects divergence conditions by comparing recent lows/highs in price with the RSI.
Parameter : Length of 8.
Bollinger Bands (BB) :
Purpose : Measures volatility and identifies price levels that are statistically extreme.
Parameter : Length of 20 and a 2-standard deviation multiplier.
ADX (Average Directional Index) & DMI (Directional Movement Index) :
Purpose : Quantifies the strength of the trend. The ADX threshold is set at 20, and additional filters check for the alignment of the directional indicators (DI+ and DI–).
ATR (Average True Range) :
Purpose : Provides a volatility measure used to set stop levels and determine risk through trailing stops.
Volume SMA (Simple Moving Average of Volume ):
Purpose : Helps confirm strength by comparing the current volume against a 20-period average, with an optional filter to ensure volume is at least twice the SMA.
User-Defined Toggle Filters :
Volume Filter : Confirms that the volume is above average (or twice the SMA) before taking trades.
ADX Trend Alignment Filter : Checks that the ADX’s directional indicators support the trade direction.
BB Close Confirmation : Optionally refines the entry by requiring price to be beyond the upper or lower Bollinger Band rather than just above or below.
RSI Divergence Exit : Allows the script to close positions if RSI divergence is detected.
BB Mean Reversion Exit : Closes positions if the price reverts to the Bollinger Bands’ middle line.
Risk/Reward Filter : Ensures that the potential reward is at least twice the risk by comparing the distance to the Bollinger Band with the ATR.
Candle Movement Filter : Optional filter to require a minimum percentage move in the candle to confirm momentum.
ADX Trend Exit : Closes positions if the ADX falls below the threshold and the directional indicators reverse.
Entry Conditions :
Bullish Entry :
RSI Divergence : Checks if the current close is lower than a previous low while the RSI is above the previous low, suggesting bullish divergence.
Bollinger Confirmation : Requires that the price is above the lower (or upper if confirmation is toggled) Bollinger Band.
Volume & Trend Filters : Combines volume condition, ADX strength, and an optional candle momentum condition.
Risk/Reward Check : Validates that the trade meets a favorable risk-to-reward ratio.
Bearish Entry :
Uses a mirror logic of the bullish entry by checking for bearish divergence, ensuring the price is below the appropriate Bollinger level, and confirming volume, trend strength, candle pattern, and risk/reward criteria.
Trade Execution and Exit Strateg y:
Trade Execution :
Upon meeting the entry conditions, the strategy initiates a long or short position.
Stop Loss & Trailing Stops :
A stop-loss is dynamically set using the ATR value, and trailing stops are implemented as a percentage of the close price.
Exit Conditions :
Additional exit filters can trigger early closures based on RSI divergence, mean reversion (via the middle Bollinger Band), or a weakening trend as signaled by ADX falling below its threshold.
This multi-layered exit strategy is designed to lock in gains or minimize losses if the market begins to reverse unexpectedly.
How the Strategy Works in Different Market Conditions :
Trending Markets :
The ADX filter ensures that trades are only taken when the trend is strong. When the market is trending, the directional movement indicators help confirm the momentum, making the reversal signal more reliable.
Ranging Markets :
In choppy markets, the Bollinger Bands expand and contract, while the RSI divergence can highlight potential turning points. The optional filters can be adjusted to avoid false signals in low-volume or low-volatility conditions.
Volatility Management :
With ATR-based stop-losses and a risk/reward filter, the strategy adapts to current market volatility, ensuring that risk is managed consistently.
Recommendation on using this Strategy with a Trading Bot :
This strategy is well-suited for high-frequency trading (HFT) due to its ability to quickly identify reversal setups and execute trades dynamically with automated stop-loss and trailing exits. By integrating this script with a TradingView webhook-based bot or an API-driven execution system, traders can automate trade entries and exits in real-time, reducing manual execution delays and capitalizing on fast market movements.
Disclaimer :
This script is provided for educational and informational purposes only. It is not intended as investment advice. Trading involves significant risk, and you should always conduct your own research and analysis before making any trading decisions. The author is not responsible for any losses incurred while using this script.

Chandelier Exit Strategy with 200 EMA FilterStrategy Name and Purpose
Chandelier Exit Strategy with 200EMA Filter
This strategy uses the Chandelier Exit indicator in combination with a 200-period Exponential Moving Average (EMA) to generate trend-based trading signals. The main purpose of this strategy is to help traders identify high-probability entry points by leveraging the Chandelier Exit for stop loss levels and the EMA for trend confirmation. This strategy aims to provide clear rules for entries and exits, improving overall trading discipline and performance.
Originality and Usefulness
This script integrates two powerful indicators to create a cohesive and effective trading strategy:
Chandelier Exit : This indicator is based on the Average True Range (ATR) and identifies potential stop loss levels. The Chandelier Exit helps manage risk by setting stop loss levels at a distance from the highest high or lowest low over a specified period, multiplied by the ATR. This ensures that the stop loss adapts to market volatility.
200-period Exponential Moving Average (EMA) : The EMA acts as a trend filter. By ensuring trades are only taken in the direction of the overall trend, the strategy improves the probability of success. For long entries, the close price must be above the 200 EMA, indicating a bullish trend. For short entries, the close price must be below the 200 EMA, indicating a bearish trend.
Combining these indicators adds layers of confirmation and risk management, enhancing the strategy's effectiveness. The Chandelier Exit provides dynamic stop loss levels based on market volatility, while the EMA ensures trades align with the prevailing trend.
Entry Conditions
Long Entry
A buy signal is generated by the Chandelier Exit.
The close price is above the 200 EMA, indicating a strong bullish trend.
Short Entry
A sell signal is generated by the Chandelier Exit.
The close price is below the 200 EMA, indicating a strong bearish trend.
Exit Conditions
For long positions: The position is closed when a sell signal is generated by the Chandelier Exit.
For short positions: The position is closed when a buy signal is generated by the Chandelier Exit.
Risk Management
Account Size: 1,000,00 yen
Commission and Slippage: 17 pips commission and 1 pip slippage per trade
Risk per Trade: 10% of account equity
Stop Loss: For long trades, the stop loss is placed slightly below the candle that generated the buy signal. For short trades, the stop loss is placed slightly above the candle that generated the sell signal. The stop loss levels are dynamically adjusted based on the ATR.
Settings Options
ATR Period: Set the period for calculating the ATR to determine the Chandelier Exit levels.
ATR Multiplier: Set the multiplier for ATR to define the distance of stop loss levels from the highest high or lowest low.
Use Close Price for Extremums: Choose whether to use the close price for calculating the extremums.
EMA Period: Set the period for the EMA to adjust the trend filter sensitivity.
Show Buy/Sell Labels: Choose whether to display buy and sell labels on the chart for visual confirmation.
Highlight State: Choose whether to highlight the bullish or bearish state on the chart.
Sufficient Sample Size
The strategy has been backtested with a sufficient sample size to evaluate its performance accurately. This ensures that the strategy's results are statistically significant and reliable.
Notes
This strategy is based on historical data and does not guarantee future results.
Thoroughly backtest and validate results before using in live trading.
Market volatility and other external factors can affect performance and may not yield expected results.
Acknowledgment
This strategy uses the Chandelier Exit indicator. Special thanks to the original contributors for their work on the Chandelier Exit concept.
Clean Chart Explanation
The script is published with a clean chart to ensure that its output is readily identifiable and easy to understand. No other scripts are included on the chart, and any drawings or images used are specifically to illustrate how the script works.

FVG Positioning Average with 200EMA Auto Trading [Pakun]Description
Strategy Name and Purpose
FVG Positioning Average with 200EMA Auto Trading
This strategy uses Fair Value Gaps (FVG) combined with a 200-period Exponential Moving Average (EMA) and Average True Range (ATR) to generate trend-based trading signals. It is designed to help traders identify high-probability entry points by leveraging the gaps between fair value prices and current market prices.
Originality and Usefulness
This script combines multiple indicators to create a cohesive trading strategy that is greater than the sum of its parts. While FVG is a powerful tool on its own, combining it with the EMA and ATR adds layers of confirmation and risk management, enhancing its effectiveness. Here’s how the components work together:
Fair Value Gap (FVG): Identifies gaps in the market where price action has not fully filled, indicating potential reversal or continuation points.
200-period Exponential Moving Average (EMA): Acts as a trend filter to ensure trades are taken in the direction of the overall trend, improving the probability of success.
Average True Range (ATR): Used to filter out insignificant gaps and set dynamic stop-loss levels based on market volatility, enhancing risk management.
Entry Conditions
Long Entry
The close price crosses above the downtrend FVG.
The close price, FVG up average, and down average are all above the 200 EMA, indicating a strong bullish trend.
Short Entry
The close price crosses below the uptrend FVG.
The close price, FVG up average, and down average are all below the 200 EMA, indicating a strong bearish trend.
Exit Conditions
For long positions, the stop loss is set at the recent low, and the take profit is set at a point with a risk-reward ratio of 1:1.5.
For short positions, the stop loss is set at the recent high, and the take profit is set at a point with a risk-reward ratio of 1:1.5.
Risk Management
Account Size: 1,000,000 yen
Commission and Slippage: 2 pips commission and 1 pip slippage per trade
Risk per Trade: 10% of account equity
The stop loss is based on the recent low or recent high, ensuring trades are exited when the market moves against the position.
Settings Options
FVG Lookback: Set the lookback period for calculating FVGs.
Lookback Type: Choose the type of lookback (Bar Count or FVG Count).
ATR Multiplier: Set the multiplier for ATR to filter significant gaps.
EMA Period: Set the period for the EMA to adjust the trend filter sensitivity.
Show FVGs on Chart: Choose whether to display FVGs on the chart for visual confirmation.
Bullish/Bearish Color: Set the color for bullish and bearish FVGs to distinguish them easily.
Show Gradient Areas: Choose whether to display gradient areas to highlight the zones of interest.
Sufficient Sample Size
The strategy has been backtested with 113 trades, providing a sufficient sample size to evaluate its performance.
Notes
This strategy is based on historical data and does not guarantee future results.
Thoroughly backtest and validate results before using in live trading.
Market volatility and other external factors can affect performance and may not yield expected results.
Acknowledgment
This strategy uses the FVG Positioning Average Strategy indicator. Thanks to for their contribution.
Clean Chart Explanation
The script is published with a clean chart to ensure that its output is readily identifiable and easy to understand. No other scripts are included on the chart, and any drawings or images used are specifically to illustrate how the script works.

VAWSI and Trend Persistance Reversal Strategy SL/TPThis is a completely revamped version of my "RSI and ATR Trend Reversal Strategy."
What's New?
The RSI has been replaced with an original indicator of mine, the "VAWSI," as I've elected to call it.
The standard RSI measures a change in an RMA to determine the strength of a movement.
The VAWSI performs very similarly, except it uses another original indicator of mine, the VAWMA.
VAWMA stands for "Volume (and) ATR Weight Moving Average." It takes an average of the volume and ATR and uses the ratio of each bar to weigh a moving average of the source.
It has the same formula as an RSI, but uses the VAWMA instead of an RMA.
Next we have the Trend Persistence indicator, which is an index on how long a trend has been persisting for. It is another original indicator. It takes the max deviation the source has from lowest/highest of a specified length. It then takes a cumulative measure of that amount, measures the change, then creates a strength index with that amount.
The VAWSI is a measure of an emerging trend, and the Trend Persistence indicator is a measure of how long a trend has persisted.
Finally, the 3rd main indicator, is a slight variation of an ATR. Rather than taking the max of source - low or high- source and source - source , it instead takes the max of high-low and the absolute value of source - the previous source. It then takes the absolute value of the change of this, and normalizes it with the source.
Inputs
Minimum SL/TP ensures that the Stop Loss and Take Profit still exist in untrendy markets. This is the minimum Amount that will always be applied.
VAWSI Weight is a divided by 100 multiplier for the VAWSI. So value of 200 means it is multiplied by 2. Think of it like a percentage.
Trend Persistence weight and ATR Weight are applied the same. Higher the number, the more impactful on the final calculation it is.
Combination Mult is an outright multiplier to the final calculation. So a 2.0 = * 2.0
Trend Persistence Smoothing Length is the length of the weighted moving average applied to the Trend Persistence Strength index.
Length Cycle Decimal is a replacement of length for the script.
Here we used BlackCat1402's Dynamic Length Calculation, which can be found on his page. With his permission we have implemented it into this script. Big shout out to them for not only creating, but allowing us to use it here.
The Length Cycle Decimal is used to calculate the dynamic length. Because TradingView only allows series int for their built-in library, a lot of the baseline indicators we use have to be manually recreated as functions in the following section.
The Strategy
As usual, we use Heiken Ashi values for calculations.
We begin by establishing the minimum SL/TP for use later.
Next we determine the amount of bars back since the last crossup or crossdown of our threshold line.
We then perform some normalization of our multipliers. We want a larger trend or larger VAWSI amount to narrow the threshold, so we have 1 divide them. This way, a higher reading outputs a smaller number and vice versa. We do this for both Trend Persistence, and the VAWSI.
The VAWSI we also normalize, where rather than it being a 0-100 reading of trend direction and strength, we absolute it so that as long as a trend is strong, regardless of direction, it will have a higher reading. With these normalized values, we add them together and simply subtract the ATR measurement rather than having 1 divide it.
Here you can see how the different measurements add up. A lower final number suggests imminent reversal, and a higher final number suggests an untrendy or choppy market.
ATR is in orange, the Trend Persistence is blue, the VAWSI is purple, and the final amount is green.
We take this final number and depending on the current trend direction, we multiply it by either the Highest or Lowest source since the last crossup or crossdown. We then take the highest or lowest of this calculation, and have it be our Stop Loss or Take Profit. This number cannot be higher/lower than the previous source to ensure a rapid spike doesn't immediately close your position on a still continuing trend. As well, the threshold cannot be higher/ lower than the the specified Stop Loss and Take Profit
Only after the source has fully crossed these lines do we consider it a crossup or crossdown. We confirm this with a barstate.isconfirmed to prevent repainting. Next, each time there is a crossup or crossdown we enter a long or a short respectively and plot accordingly.
I have the strategy configured to "process on order close" to ensure an accurate backtesting result. You could also set this to false and add a 1 bar delay to the "if crossup" and "if crossdown" lines under strategy so that it is calculated based on the open of the next bar.
Final Notes
The amounts have been preconfigured for performance on RIOT 5 Minute timeframe. Other timeframes are viable as well. With a few changes to the parameters, this strategy has backtested well on NVDA, AAPL, TSLA, and AMD. I recommend before altering settings to try other timeframes first.
This script does not seem to perform nearly as well in typically untrendy and choppy markets such as crypto and forex. With some setting changes, I have seen okay results with crypto, but overfitting could be the cause there.
Thank you very much, and please enjoy.

TASC 2024.06 REIT ETF Trading System█ OVERVIEW
This strategy script demonstrates the application of the Real Estate Investment Trust (REIT) ETF trading system presented in the article by Markos Katsanos titled "Is The Price REIT?" from TASC's June 2024 edition of Traders' Tips .
█ CONCEPTS
REIT stocks and ETFs offer a simplified, diversified approach to real estate investment. They exhibit sensitivity to interest rates, often moving inversely to interest rate and treasury yield changes. Markos Katsanos explores this relationship and the correlation of prices with the broader market to develop a trading strategy for REIT ETFs.
The script employs Bollinger Bands and Donchian channel indicators to identify oversold conditions and trends in REIT ETFs. It incorporates the 10-year treasury yield index (TNX) as a proxy for interest rates and the S&P 500 ETF (SPY) as a benchmark for the overall market. The system filters trade entries based on their behavior and correlation with the REIT ETF price.
█ CALCULATIONS
The strategy initiates long entries (buy signals) under two conditions:
1. Oversold condition
The weekly ETF low price dips below the 15-week Bollinger Band bottom, the closing price is above the value by at least 0.2 * ATR ( Average True Range ), and the price exceeds the week's median.
Either of the following:
– The TNX index is down over 15% from its 25-week high, and its correlation with the ETF price is less than 0.3.
– The yield is below 2%.
2. Uptrend
The weekly ETF price crosses above the previous week's 30-week Donchian channel high.
The SPY ETF is above its 20-week moving average.
Either of the following:
– Over ten weeks have passed since the TNX index was at its 30-week high.
– The correlation between the TNX value and the ETF price exceeds 0.3.
– The yield is below 2%.
The strategy also includes three exit (sell) rules:
1. Trailing (Chandelier) stop
The weekly close drops below the highest close over the last five weeks by over 1.5 * ATR.
The TNX value rises over the latest 25 weeks, with a yield exceeding 4%, or its value surges over 15% above the 25-week low.
2. Stop-loss
The ETF's price declines by at least 8% of the previous week's close and falls below the 30-week moving average.
The SPY price is down by at least 8%, or its correlation with the ETF's price is negative.
3. Overbought condition
The ETF's value rises above the 100-week low by over 50%.
The ETF's price falls over 1.5 * ATR below the 3-week high.
The ETF's 10-week Stochastic indicator exceeds 90 within the last three weeks.
█ DISCLAIMER
This strategy script educates users on the system outlined by the TASC article. However, note that its default properties might not fully represent real-world trading conditions for an individual. By default, it uses 10% of equity as the order size and a slippage amount of 5 ticks. Traders should adjust these settings and the commission amount when using this script. Additionally, since this strategy utilizes compound conditions on weekly data to trigger orders, it will generate significantly fewer trades than other, higher-frequency strategies.

Advanced EMA Cross with Normalized ATR Filter, Controlling ADX
Description:
This strategy is based on EMA cross strategy and additional filters are used to get better results, a normalized ATR filter, and ADX control...
It aims to provide traders with a code base that generates signals for long positions based on market conditions defined by various indicators.
How it Works:
1. EMA: Uses short (8 periods) and long (20 periods) EMAs to identify crossovers.
2. ATR: Uses a 14-period ATR, normalized to its 20-period historical range, to filter out noise.
3. ADX: Uses a 14-period RMA to identify strong trends.
4. Volume: Filters trades based on a 14-period SMA of volume.
5. Super Trend: Uses a Super Trend indicator to identify the market direction.
How to Use:
- Buy Signal: Generated when EMA short crosses above EMA long, and other conditions like ATR and market direction are met.
- Sell Signal: Generated based on EMA crossunder and high ADX value.
Originality and Usefulness:
This script combines EMA, ATR, ADX, and Super Trend indicators to filter out false signals and identify more reliable trading opportunities.
USD Strength in the code is not working, just simulated it as PSEUDO CODE:
Strategy Results:
- Account Size: $1000
- Commission: Not considered
- Slippage: Not considered
- Risk: Manageable through parameters, now less than 5% per trade
- Dataset: Aim for more than 100 trades for a sufficient sample size
- Test Conditions: Test in 30 min chart for BTCUSDT
IMPORTANT NOTE: This script should be used for educational purposes and should not be considered as financial advice.
Chart:
- The script's output is plotted as Buy and Sell signals on the chart.
- No other scripts are included for clarity.
- Have tested with 30mins period
- You are encouraged to play with parameters, let me know if it helps you and/or if you can upgrade the code to a better level.
WHY DID I USE ATR AND ADX?
ATR filter is usually used for the following purposes.
Market Volatility: ATR measures how volatile the market is. High ATR values indicate that the price is experiencing significant fluctuations.
Filtering: Crossing a certain ATR threshold may indicate that the market is active enough to present trading opportunities.
Risk Management: ATR can also be used to set stop-loss and take-profit levels, helping to manage risk effectively.
And ADX is usually used for;
Trend Strength: ADX measures the strength of a trend. High ADX values indicate a strong trend.
Filtering: An ADX value above a certain level suggests that the trend is strong and it might be safer to trade.
Versatility: ADX does not indicate the direction of the trend, only its strength. This makes it useful in both bullish and bearish markets.
Using these indicators together can help filter out false signals and produce more reliable trading signals. While ATR helps to determine if the market is active enough, ADX measures the strength of the trend. Combined, they can create a more complex and effective trading strategy.
I've used ADX data to support generating a buy signal after a golden cross (bullish trend) and waiting until this is a strong trend. It sounds good to check for different trend strengths for bullish and bearish markets to decide a buy signal. Additionally I used ATR to check if the market has enough fluctuations.

Advanced VWAP_Pullback Strategy_Trend-Template QualifierGeneral Description and Unique Features of this Script
Introducing the Advanced VWAP Momentum-Pullback Strategy (long-only) that offers several unique features:
1. Our script/strategy utilizes Mark Minervini's Trend-Template as a qualifier for identifying stocks and other financial securities in confirmed uptrends. Mark Minervini, a 2x US Investment Champion, developed the Trend-Template, which covers eight different and independent characteristics that can be adjusted and optimized in this trend-following strategy to ensure the best results. The strategy will only trigger buy-signals in case the optimized qualifiers are being met.
2. Our strategy is based on the supply/demand balance in the market, making it timeless and effective across all timeframes. Whether you are day trading using 1- or 5-min charts or swing-trading using daily charts, this strategy can be applied and works very well.
3. We have also integrated technical indicators such as the RSI and the MA / VWAP crossover into this strategy to identify low-risk pullback entries in the context of confirmed uptrends. By doing so, the risk profile of this strategy and drawdowns are being reduced to an absolute minimum.
Minervini’s Trend-Template and the ‘Stage-Analysis’ of the Markets
This strategy is a so-called 'long-only' strategy. This means that we only take long positions, short positions are not considered.
The best market environment for such strategies are periods of stable upward trends in the so-called stage 2 - uptrend.
In stable upward trends, we increase our market exposure and risk.
In sideways markets and downward trends or bear markets, we reduce our exposure very quickly or go 100% to cash and wait for the markets to recover and improve. This allows us to avoid major losses and drawdowns.
This simple rule gives us a significant advantage over most undisciplined traders and amateurs!
'The Trend is your Friend'. This is a very old but true quote.
What's behind it???
• 98% of stocks made their biggest gains in a Phase 2 upward trend.
• If a stock is in a stable uptrend, this is evidence that larger institutions are buying the stock sustainably.
• By focusing on stocks that are in a stable uptrend, the chances of profit are significantly increased.
• In a stable uptrend, investors know exactly what to expect from further price developments. This makes it possible to locate low-risk entry points.
The goal is not to buy at the lowest price – the goal is to buy at the right price!
Each stock goes through the same maturity cycle – it starts at stage 1 and ends at stage 4
Stage 1 – Neglect Phase – Consolidation
Stage 2 – Progressive Phase – Accumulation
Stage 3 – Topping Phase – Distribution
Stage 4 – Downtrend – Capitulation
This strategy focuses on identifying stocks in confirmed stage 2 uptrends. This in itself gives us an advantage over long-term investors and less professional traders.
By focusing on stocks in a stage 2 uptrend, we avoid losses in downtrends (stage 4) or less profitable consolidation phases (stages 1 and 3). We are fully invested and put our money to work for us, and we are fully invested when stocks are in their stage 2 uptrends.
But how can we use technical chart analysis to find stocks that are in a stable stage 2 uptrend?
Mark Minervini has developed the so-called 'trend template' for this purpose. This is an essential part of our JS-TechTrading pullback strategy. For our watchlists, only those individual values that meet the tough requirements of Minervini's trend template are eligible.
The Trend Template
• 200d MA increasing over a period of at least 1 month, better 4-5 months or longer
• 150d MA above 200d MA
• 50d MA above 150d MA and 200d MA
• Course above 50d MA, 150d MA and 200d MA
• Ideally, the 50d MA is increasing over at least 1 month
• Price at least 25% above the 52w low
• Price within 25% of 52w high
• High relative strength according to IBD.
NOTE: In this basic version of the script, the Trend-Template has to be used as a separate indicator on TradingView (Public Trend-Template indicators are available in TradingView – community scripts). It is recommended to only execute buy signals in case the stock or financial security is in a stage 2 uptrend, which means that the criteria of the trend-template are fulfilled.
This strategy can be applied to all timeframes from 5 min to daily.
The VWAP Momentum-Pullback Strategy
For the JS-TechTrading VWAP Momentum-Pullback Strategy, only stocks and other financial instruments that meet the selected criteria of Mark Minervini's trend template are recommended for algorithmic trading with this startegy.
A further prerequisite for generating a buy signals is that the individual value is in a short-term oversold state (RSI).
When the selling pressure is over and the continuation of the uptrend can be confirmed by the MA / VWAP crossover after reaching a price low, a buy signal is issued by this strategy.
Stop-loss limits and profit targets can be set variably. You also have the option to make use of the trailing stop exit strategy.
Relative Strength Index (RSI)
The Relative Strength Index (RSI) is a technical indicator developed by Welles Wilder in 1978. The RSI is used to perform a market value analysis and identify the strength of a trend as well as overbought and oversold conditions. The indicator is calculated on a scale from 0 to 100 and shows how much an asset has risen or fallen relative to its own price in recent periods.
The RSI is calculated as the ratio of average profits to average losses over a certain period of time. A high value of the RSI indicates an overbought situation, while a low value indicates an oversold situation. Typically, a value > 70 is considered an overbought threshold and a value < 30 is considered an oversold threshold. A value above 70 signals that a single value may be overvalued and a decrease in price is likely , while a value below 30 signals that a single value may be undervalued and an increase in price is likely.
For example, let's say you're watching a stock XYZ. After a prolonged falling movement, the RSI value of this stock has fallen to 26. This means that the stock is oversold and that it is time for a potential recovery. Therefore, a trader might decide to buy this stock in the hope that it will rise again soon.
The MA / VWAP Crossover Trading Strategy
This strategy combines two popular technical indicators: the Moving Average (MA) and the Volume Weighted Average Price (VWAP). The MA VWAP crossover strategy is used to identify potential trend reversals and entry/exit points in the market.
The VWAP is calculated by taking the average price of an asset for a given period, weighted by the volume traded at each price level. The MA, on the other hand, is calculated by taking the average price of an asset over a specified number of periods. When the MA crosses above the VWAP, it suggests that buying pressure is increasing, and it may be a good time to enter a long position. When the MA crosses below the VWAP, it suggests that selling pressure is increasing, and it may be a good time to exit a long position or enter a short position.
Traders typically use the MA VWAP crossover strategy in conjunction with other technical indicators and fundamental analysis to make more informed trading decisions. As with any trading strategy, it is important to carefully consider the risks and potential rewards before making any trades.
This strategy is applicable to all timeframes and the relevant parameters for the underlying indicators (RSI and MA/VWAP) can be adjusted and optimized as needed.
Backtesting
Backtesting gives outstanding results on all timeframes and drawdowns can be reduced to a minimum level. In this example, the hourly chart for MCFT has been used.
Settings for backtesting are:
- Period from Jan 2020 until March 2023
- Starting capital 100k USD
- Position size = 25% of equity
- 0.01% commission = USD 2.50.- per Trade
- Slippage = 2 ticks
Other comments
- This strategy has been designed to identify the most promising, highest probability entries and trades for each stock or other financial security.
- The combination of the Trend-Template and the RSI qualifiers results in a highly selective strategy which only considers the most promising swing-trading entries. As a result, you will normally only find a low number of trades for each stock or other financial security per year in case you apply this strategy for the daily charts. Shorter timeframes will result in a higher number of trades / year.
- Consequently, traders need to apply this strategy for a full watchlist rather than just one financial security.

3Commas Bot DCA Backtester & Signals FREEThis is a DCA Strategy backtester + signals, built to emulate the 3Commas DCA bots. It uses your choice of 4 different buy signals, 2 of which can be adjusted in the settings. Everything is customizable so you can backtest specific settings with different buy signals and find the best performing strategy for your risk tolerance and capital. It can be used to backtest strategies on stocks as well, but just make sure your base order is larger than the share price for the entire backtesting range or it will not calculate properly.
You can use this template to code your own buy signals and then backtest them as a DCA strategy if you know some basic pine script.
The indicator shows all of your backtesting orders on the chart. The red line is your take profit level, the blue line is your average price level, the white line is your first order and the green lines are your average down orders. If you enable a stop loss in the settings your stop loss will be shown as an orange line once all of your average down orders have been hit, it will not be set until price has dipped below your covered trading range.
These levels update when things change during backtesting so you can visualize your strategy and how it would perform as well as see if your percentage deviation is large enough to cover dips. When backtesting trades are taken, the chart will show where they were taken(in backtesting) along with info on those trades such as the number each order is, the size of that order and the percentage deviation that order is from the initial buy.
SENDING SIGNALS TO 3COMMAS
Tradingview cannot sync this backtester to 3Commas and with the way alerts are setup for strategies on Tradingview, the best option for you to give signals to your bot would be to use this backtester to figure out what trigger you want to use and then setup that indicator separately to send alerts to your bot. All of the indicators used for signals in this backtester are available for free and can be configured to match this backtester and send alerts to 3Commas for you. Just make sure you set your alerts to once per bar close and don’t use less than a 15 second timeframe because then you could trigger the Tradingview threshold for alerts and get your alerts shut off.
You can also use this backtester with your own buy triggers if you know a little pine script. Just make copy of the script and code in your own buy signals and see how it backtests.
INFO PANEL FOR ANALYZING YOUR STRATEGY
The right hand side of the screen will show an info panel that shows a lot of different information so you can quickly see your bot settings and how it performed right on the screen.
In the top right corner you will see in purple your bot settings. These include your stoploss % if turned on, take profit %, average down order %, average down order % multiplier, volume multiplier, max number of orders allowed and size of your base order.
The top section of the first column “Current Trade” shows these stats: the open trade’s average price, the open trade’s take profit price, the open trade’s PNL, how far price is from your open tarde’s take profit level in percentage, your open position size and number of open orders.
The bottom section of the first column “Overall Performance” shows these stats: total number of trades taken during backtesting range, the largest amount of trades that were open at one time during backtesting, the max drawdown, the average number of bars per trade, gross profit, net profit, percent profit from your initial capital, current portfolio value and your initial capital.
CUSTOMIZABLE OPTIONS TO FIND THE PERFECT STRATEGY
Stoploss On/Off
This will turn your stoploss on or off. By default it is set to off and will not affect anything unless turned on.
Stoploss Percentage
This is the percentage below your final average down order price that will be set as a stoploss to keep your account from going too far in the red on big dips.
Take Profit Percentage - This is the percentage of profit you want the trade to hit before taking profit on your entire DCA trade. This level updates everytime you average down.
Average Down Percentage - This is the percentage that price has to drop from your initial order to initiate your first safety order. If the Average Down Percent Multiplier is set to 1 then this percentage will be the same for every average down order.
Average Down Percentage Multiplier - This multiplies your Average Down Percentage so each safety order needs a larger percentage deviation than the previous one. This keeps your buys closer together at the beginning and further apart when you hit more orders so you can extend your trading range but still be aggressive when price is going sideways.
Volume Multiplier Per New Order - This multiplies the size of each trade based on your base order. If you set it to a 2x multiplier then each average down order will be 2 times the size of the last one. So for example, a $100 base order with a 2x multiplier would have these values for the first 3 average down orders: 200, 400, 800.
Size Of Base Order - This is the size of your first position entry and will be used as a starting point for the volume multiplier. If your base order is $100 then it will buy $100 worth of whatever crypto you are backtesting this on. If you are looking at stock charts, you need to make sure your base order is higher than the share price across the entire backtesting range or it will not perform correctly.
Max Number Of Orders - This is the maximum number of orders the bot can take, including your base order. Adjust this to suit the amount of capital you are willing to allocate to your bot based on how much money it will require to run according to your bot settings.
TIPS ON HOW TO USE FOR BEST RESULTS
If you don’t have a lot of capital to work with, then use longer timeframes with a reasonable take profit percentage so that you don’t need a lot of average down orders. You can also try keeping the volume multiplier close to 1.
You can use the 3Commas dca bot settings page to see how much capital you will need for your strategy if you match it to the settings you have on this indicator. You can also check to see how much of a percentage deviation your bot is covering to make sure you have a reasonable range to trade in and orders to cover big dips. You can also check your coverage by seeing how far down the chart the green lines cover, which are your average down orders.
Make sure the initial capital in the properties tab of the settings has enough to cover all of your orders otherwise you will get unrealistic backtesting results. Also, make sure you leave the order size in the properties tab on contracts so it calculates your trades correctly. The only settings you need to touch in the properties tab is the initial capital. Unless you are trading somewhere that has lower commission fees, then you can change that to match, but leave all the other settings as is for it to function properly.
Increasing the volume multiplier will make your average price and take profit target follow the price action a lot closer as price falls, but it can also lead to having very large orders very quickly once you get into the 1.5-3x multiple range. Try using a high volume multiplier with less safety orders and you will get better results, however you need to have money on the sidelines to add on major dips to keep your bot turning a profit. Be very careful with this as greed and impatience will hurt your overall performance. This bot is meant to make money with lots of small wins so don’t get greedy and make sure you have enough money to cover large dips. If you are being aggressive with your bot, then I recommend only using 25% or less of your portfolio to trade aggressively and then use the smart trade feature on 3commas to add chunks of funds to your trades when price dips below your last safety order. Or if you want it to run without any supervision, then use lower volume multipliers and have lots of safety orders that can cover entire bear markets and still keep buying lower.
It’s a good idea to have some capital on the sidelines that you can add in when price dips quickly. This will help lower your average price and allow your bot to get out in profit quicker. 3Commas bot has a smart trade feature that will allow you to track your average price when adding extra funds and it will automatically update your other orders which is very convenient. Look at the longer timeframes when price dips and only add chunks at major areas where price is very likely to bounce. Or you can be aggressive when trading and add to your position when price dips and is at a likely bounce zone to maximize profits.
Only trade coins that have a good amount of liquidity as the larger your orders get, the harder it will be to sell if there isn’t much liquidity. Also, beware of how large your first order is as it will usually be a market order and can move the market if there is not much liquidity.
Since this bot takes a lot of trades and performs best when taking small profits consistently, you will need to factor in exchange fees. The bot is set to .5% commission(you can change this) on the buy and sell orders as most exchanges charge that amount. Some exchanges offer no fee trading on certain coins so be sure to look around for those so you can keep the commissions and maximize profits.
I strongly encourage you to try out a lot of different setting combinations across multiple different coins and do it across a few months to see how it would have performed under various market conditions. This will help you get a better idea of how much of a percentage deviation you’ll need to be able to cover to keep your bot running and making constant profits. You can also use the deep backtesting feature of the strategy panel to see how it would have done, but just beware that the info panel of the indicator will not reflect deep backtesting results, only the normal backtesting range.
MARKETS
This backtester can be used on any market including crypto, stocks, forex & futures. You just need to make sure your base order is larger than the share price when using this on things besides crypto.
TIMEFRAMES
This backtester can be used on all timeframes.
